Communicating Statistics
This page attempts to collect examples of effectively communicating statistics from across the internet. The objective is to learn how to communicate statistics in a way that leads to impact and action. If you have come across other similar examples and would like them to be included here, please write to me.
1. Leverage the ongoing Bitcoin frenzy to make your point

2. Bring context to tell the extra-ordinariness of a Statistic

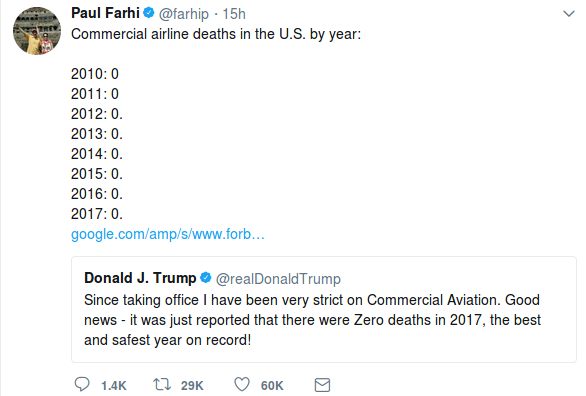
3. Trend of data-points is always more convincing than single data-point
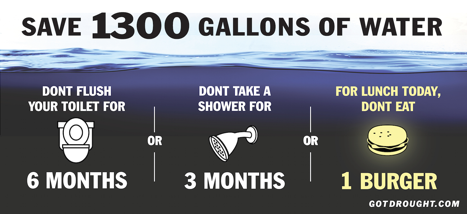
4. Action driven statistic that speaks it's enormity by bringing in context. Also brings in context by translating statistics into regular tasks.
5. Always compare with something familiar to your audience (notice the Statue of Liberty in this below image) to make sure they get the context.

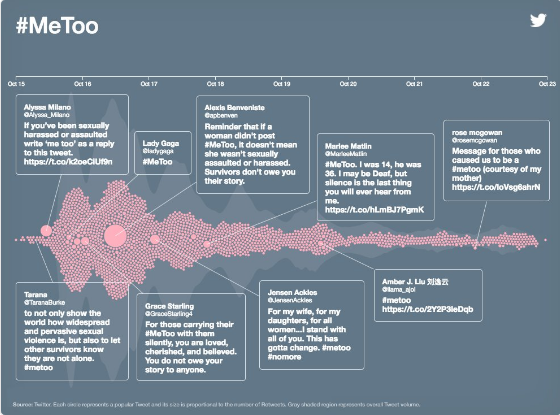
6. Right visualization can help you summarize a lot of information and draw the reader's attention to right highlights - all in a single view
7. Bringing in context is alright. But bringing it by comparing with something that the audience can recall right away is a definite way to draw attention.

8. Enormity of a statistical figure sinks in much better if you make it relatable with something that the audience can recall quickly (the protest in the tweet below) and a figure that audience can grasp better (Rs 36 lakhs)

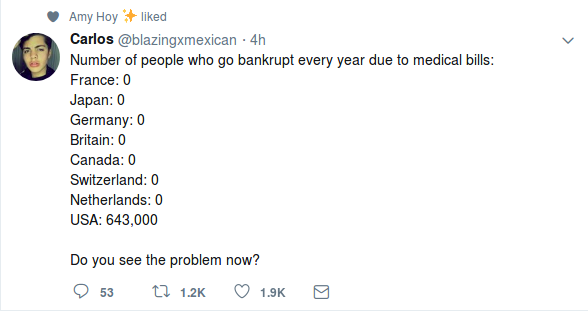
9. Most numbers mean nothing without a context. Imagine seeing the below tweet, but only with USA numbers. Talking a number without context is nearly equivalent to not saying.
10. If numbers can be represented visually to communicate impact of the point thosee numbers are trying to make - it helps use power of statistics for an emotional impact.