Hazel-eyed visitors are more likely to buy your product : Insight or illusion?
Is your latest Analytics Insight a real signal or random noise? We try to understand how Statistical Significance can help us answer this question.
Dec 6, 2017

Hazel-eyed visitors are more likely to buy your product : Insight or illusion?
Is your latest Analytics Insight a real signal or random noise? We try to understand how Statistical Significance can help us answer this question.
Dec 6, 2017
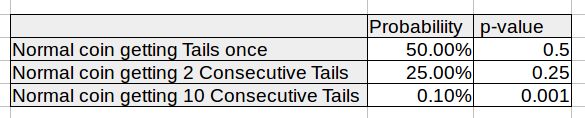
Let's say you possess a coin that you think always flips to tails. To convince your friend about your theory, you toss the coin. Tails it is. You declare your theory correct but your friend isn't impressed. Understandably so. He says there's always a 50-50 chance of getting a tails. You toss it again. Tails again. Your friend is still not convinced. Because there's always a 25% probability that a normal coin would throw tails twice. You then toss your coin 10 times with tails every time. Your friend doesn't need any more convincing. Because probability of a normal coin getting tails for 10 consecutive times is 0.0987%. This coin has to be non-normal.
What happened in the above scenario is that you had an insight (that your coin always flips to tails). And you had a certain amount of data to calculate certainty of your insight. Only once the probability of your coin being normal reached negligible level, you could say with certainty that your insight is valid.
A lot of data-driven marketing is about uncovering such insights from the tracked data:
But, before you can act on these insights, it is critical to question their certainty. Could it be just by chance that your blog subscribers made 2x more purchases last month? How can you be certain that your observation isn't something that occurred just by chance? Because, if it happened by chance, your predictions based on the observation will fall flat in future.
Going back to the coin example, the probability of the coin being a normal one (and yet flipping to tails for 10 consecutive times) is < 1%. So, you can be 99% certain that you possess a non-normal coin. And 99% certainty makes you pretty comfortable predicting future coin tosses. What you actually calculated here is Statistical Significance (p-value) of your coin insight.
Statistical Significance helps you calculate the probability (p-value) that your insight is noise and not a signal. So, a low p-value means your insight is valid. A p-value of 0.05 means that the chance of your insight being noise is 5%. So, you can be 95% certain that your insight is a valid trend. A certainty of 95% or more is considered adequate to use an insight for making decisions.
So, how do you calculate p-value for your latest experiment? Internet is full of online p-value calculators. But, turns out there are more than one formulae to calculate p-value. Each formula is suitable for a certain kind of experiment. You also need to know whether your experiment is one-tailed or two-tailed. We'll use the next post to look into these details to find out p-value for our experiments.